Real Estate Cycles in the Post-COVID Era: When You Should Buy Property? (Bali Case Examined)

The real estate market breathes, pulsates, and moves cyclically, just like the rest of the economy. To understand these complex cycles, one must orient themselves by major market crashes, which effectively reset the clock and initiate a new cycle. The 2008 financial crisis and the 2020 pandemic stand as the two most significant reset points in recent history, each producing remarkably different recovery trajectories.
The 2008 crash triggered a widespread housing market collapse (with U.S. home prices plummeting 33% on average), and recovery was painfully gradual—taking approximately 8 years for most markets to reclaim their pre-crisis values. The pandemic crash, conversely, wasn't rooted in mortgage system failures and didn't cause a broad real estate collapse, but instead generated massive sectoral divergence—with different real estate sectors experiencing dramatically contrasting outcomes.
In Bali specifically, the short-term rental market virtually shut down due to the island's heavy dependence on tourism and the sudden halt of international arrivals. Simultaneously, the long-term rental sector was doing well enough as foreign residents found themselves confined to the island. Similar disruptions manifested globally across various property segments, ultimately giving rise to distinct "micro-cycles" within different property categories.
In this article, we will examine how real estate market cycles function, how COVID has transformed their traditional patterns, and analyze Bali's unique situation. We conclude with practical recommendations tailored for each cycle phase.
Phases of the Real Estate Cycle Explained
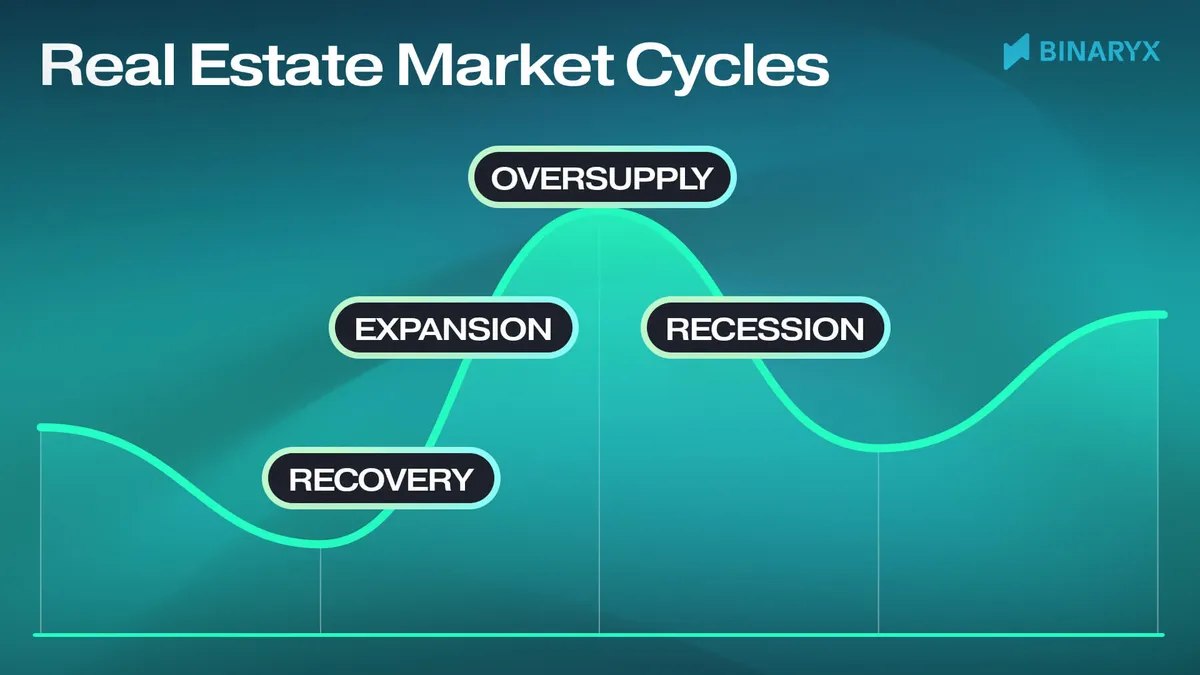
The classical real estate cycle includes four main phases: recovery, expansion, oversupply, and recession. Each stage is characterized by certain price dynamics, number of transactions, and construction volume. Each country, region, or even community may be described by its course of the cycle. Still, more often than not, local cycles correlate to some degree with the global cycle set by the U.S. economy.
Recovery
Recovery starts when the market reaches its bottom—prices have dumped enough to become attractive, even if everything else is horrendous. Unfortunately, predicting the bottom and the beginning of recovery is impossible—it can only be indicated ex post facto.
High property vacancies and a low level of construction activity, with no further signs of decline, characterize this phase. Developers are licking their wounds after the recession, and many projects remain frozen. Rental rates have stabilized at low levels, and banks are reluctant to finance new projects because they still have many distressed assets in their portfolios. Supply is not growing, but demand is gradually starting to increase.
Leading indicators of recovery:
- Property prices are stabilizing after a sharp or prolonged decline.
- Property market exposure periods have begun to shorten.
- Media headlines are rather neutral, and real estate agents' marketing departments are still in cost-saving mode and rarely bother you.
Expansion
Economic growth and the increasing purchasing power of the population trigger an expansion phase. This phase is characterized by a supply shortage – vacant spaces decrease to a minimum while demand grows.
Mortgage banks open their doors wide to borrowers, and lending conditions become more relaxed. Investors, feeling confident, begin to actively invest in new projects while finding good opportunities becomes complex as they don't remain on the market for long. The shortage of properties drives up the cost per square meter and increases rental rates. Financial indicators of projects improve, attracting even more investors and creating a snowball effect.
Key indicators of expansion:
- Real estate prices are rising month-on-month
- The number of construction projects is increasing
- Mortgage lending is growing rapidly
- The emergence of ambitious megaprojects can identify the late stage of expansion.
Oversupply
The oversupply begins subtly. Intoxicated by the previous phase's success, investors and developers stop paying attention to warning signals. They're willing to pay inflated prices for land and projects, believing that future growth will compensate for everything. During this period, the market resembles an overfilled cup from which liquid is about to spill over.
Supply begins to outpace demand, but most market participants haven't yet recognized the problem. Real estate prices continue to rise through momentum, detaching from fundamental indicators—the relationship between population income and housing costs rental yields. Construction projects initiated during the expansion phase cannot be halted immediately—and they continue to maintain the illusion that everything is fine and will get even better.
Key indicators of oversupply:
- Supply increases against a backdrop of stabilizing or declining transaction numbers.
- Price growth rates slow down.
- You increasingly find yourself struggling to choose because one option seems better than another.
- A critical indicator—the ratio of housing cost to annual income exceeds historical norms.
Recession
Recession is a painful sobering up after a period of euphoria. During this time, the market resembles a sinking ship that the rats—speculators and short-term investors—are the first to flee. They try to dispose of assets, often at any price, but selling remains difficult.
As a result, prices and rental rates decline under dual pressure—shrinking demand and growing supply. Completing construction projects continues to add to the stock of unwanted real estate, worsening the imbalance. Some initiated construction simply halts until better times, while developers face negative profits or bankruptcy. Banks tighten lending conditions and, in severe cases, stop issuing mortgages altogether.
Economic indicators of recession:
- There is a sharp or prolonged decrease in real estate prices.
- Construction volumes decline.
- The number of problematic loans and developer bankruptcies increases.
- The market sees an increase in foreclosed properties.
The recession is a time of tremendous losses for most market participants and a period when the foundation for future wealth is laid. When signs appear that something in the economy has broken, the cycle begins anew, transitioning to the recovery phase.
COVID Dump as Zero Hour for the Current Real Estate Cycle
When COVID-19 hit the world in early 2020, it was more than just another phase of recession. Lockdowns, border closures and social distancing measures led to an almost instant collapse in demand—especially in the tourism and commercial sectors. In a matter of weeks, the market stopped, a phenomenon unprecedented in recent history.

Covid brought about two major effects: cycles became faster, and the structure of demand changed dramatically:
Acceleration and Compression of Cycle Phases
Although all recessions occurred abruptly and suddenly, COVID-19 was unique because it accelerated all the other phases. As people were locked in their homes, economies in many countries practically stopped. Central banks worldwide lowered interest rates and launched quantitative easing programs to avoid collapse. These measures brought mortgage rates to historic lows. In the U.S., for example, the Case-Shiller home price index has recorded annualized gains of more than 15% in several metropolitan areas through 2021.
Whereas in the past, a market recovery could take a decade, the COVID era of cheap money has dispersed demand in a matter of years and, in some places, months. The combination of pent-up demand, low interest rates, and the return of consumer confidence has allowed the market to leapfrog several stages of recovery. The result of the unprecedented cash injections was inflation, in response to which central banks synchronously began raising key rates.
Sure, it was not only the pandemic that accelerated the processes but also technological progress, namely digitalization. But in many regards, it was precisely the pandemic that contributed to digitalization.
Shift in Investor Behavior and Demand
The pandemic has triggered a powerful rebalancing of demand. It has accelerated trends such as remote working and digital nomadism. This shift has led many buyers and renters to move from traditional urban centers to suburbs, resorts, or mixed-use locations.
An unprecedented sectoral divergence has emerged. While residential real estate boomed, commercial segments—especially office and retail—suffered a slower and more volatile recovery. The shift to remote working and the rise of e-commerce forever changed the demand structure. Some markets, such as office estates, have entered a “new normal” where pre-pandemic occupancy levels may never fully return.
Real Estate Cycles in Bali

Historical Context of Bali's Real Estate Cycles
Bali's real estate market has historically evolved through a series of ups and downs closely linked to tourism. Until the 2000s, the market was relatively undeveloped, dominated by local players and limited international interest. The market saw its first significant decline in 2002–2005, following the terrorist attacks in Bali, when prices dropped by 30–40%. The subsequent recovery was slow, taking about 3–4 years.
The period 2008-2011 was marked by rapid growth—properties in Seminyak and Canggu, fueled by growing tourist traffic and relaxation of foreign investment laws, added up to 15-20% annually. Then, there was a stabilization with growth of 5-8% per year as the market matured and slowed relative to the rapid growth of previous years. Investors gradually discovered new locations like Ubud and Uluwatu, which, one after the other, experienced a dawn. In this form, with periodic downturns and growth, the Bali market lived on until 2019.
Post-COVID Dynamics
COVID-19 has radically reset Bali's market cycles. In the first half of 2020, prices in the tourist areas (Kuta, Seminyak) fell by 15-25%, short-term rental rates collapsed by 40-60%, and transactions dropped by 70%. By the end of 2021, the market split: premium villas began to recover (+10-15% a year), while commercial properties remained depressed (-15-20% of pre-recession prices).
In 2022-2023, rental segment expansion was rapidly driven by the influx of investors and CIS countries. Long-stay villas in Canggu, Ubud, and Uluwatu showed 25–30% price increases, surpassing pre-COVID prices by mid-2022. By the end of 2024, data showed signs of oversupply in certain market segments: new villa construction in Canggu has increased by 40% since 2021, and average exposure time has increased from 45 to 75 days.
Unique Factors of influence within Bali's market
- Geographic asymmetry: Price analysis shows a 35-45% difference between different island areas, creating micro-cycles within the overall market.
- Nomad Visa: Implementing a 5-year “digital nomad visa” in 2023 has led to a 28% increase in long-term rentals and increased demand in previously undeveloped areas of Tabanan and Jimbaran.
- Legal restrictions: Foreigners cannot own land directly, creating a two-tier system with different price cycles for local and foreign investors. Leases for 25–30 years and nominal ownership structures are available to foreigners—read more in this article.
- Environmental issues: There are growing concerns about water supply and coastal erosion that have led to price declines of 10–15% in some coastal areas despite the overall upward trend of the market.
In this article, you will find out more about the Bali real estate market in 2025.
Quick Action Plan for Each Cycle
To determine what phase of the cycle the real estate market is in a particular location, it is essential to analyze the key indicators of demand, supply, and prices in their dynamics. What matters is not the separate figures but their change over time and their interconnection. We have prepared a useful and universal spreadsheet that will help you determine what phase of the cycle the market is in.
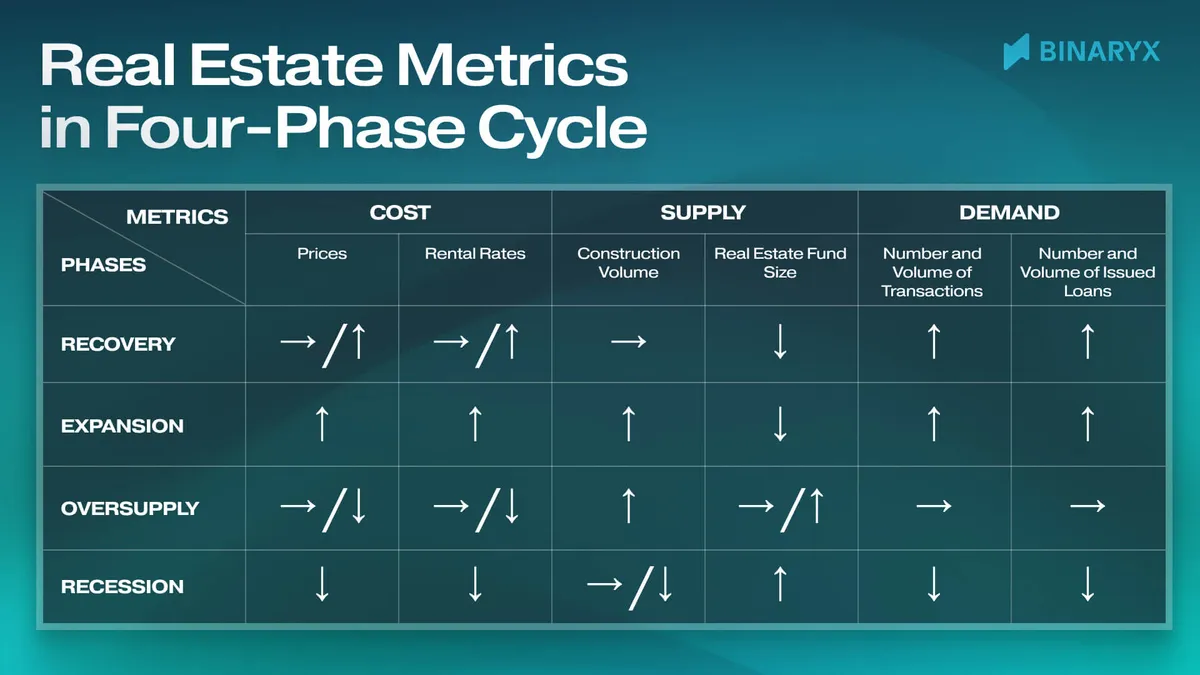
Analyzing Price Dynamics
Square meter prices and rental rates are the final indicators reflecting the demand and supply interplay. In the expansion phase, they grow; in the oversupply phase, they slow down and start to fall; in the recession phase, they fall; and in the recovery phase, they stabilize before new growth.
What matters here is not the nominal value but instead prices in the context of personal income. When housing costs rise much faster than personal income, the market is probably in an oversupply phase and heading for a recession. Use the house-price-to-income ratio or estimate the share of mortgage payments in household income.
Measuring Supply
You can track supply through data on construction activity: the number of new constructions, completed projects, and total housing stock. A rise in construction while demand is stable or slowing is a sure sign of an impending oversupply.
Estimating Demand
You can assess demand through the number of real estate transactions or the mortgage loan volume. Sales transaction registrations or remittances for real estate purchases are additional indicators. For example, a rising number of transactions with increasing mortgage volume usually indicates an expansionary phase, while a decline in these indicators is typically associated with a recession.
About Binaryx Platform
Binaryx is a real estate tokenization platform that operates under Wyoming’s 2021 law (W.S. SF0038), turning real estate properties into digital tokens. For each property, Binaryx creates a dedicated LLC in Wyoming that issues tokens on the blockchain. When you buy these tokens, you become a co-owner of the LLC that owns the property, with all ownership rights protected by state law.
Want to learn more about Binaryx? Check out these articles: